简体中文
繁體中文
English
Pусский
日本語
ภาษาไทย
Tiếng Việt
Bahasa Indonesia
Español
हिन्दी
Filippiiniläinen
Français
Deutsch
Português
Türkçe
한국어
العربية
Trading Market Profile: A Clear and Practical Guide
Abstract:Market Profile is a powerful trading tool that clearly shows where market activity concentrates—enhancing your trade decisions and timing.
What is Market Profile?
Market Profile is a charting method used by traders to understand how the market perceives value at different price levels. Unlike traditional charts, which mainly track price changes over time, Market Profile charts clearly display how much trading activity (volume or time spent) occurs at each price level.
This method helps traders visualize important price zones, indicating where buyers and sellers most actively agree upon a fair price. By knowing these levels, traders can better judge future market movements.
Key Concepts You Need to Understand
When using Market Profile, there are a few essential terms that traders must grasp clearly:
Value Area (VA):
This represents the price range within which approximately 70% of the days trading activity occurs. Traders see this range as the “fair” area where most market participants agree on price value.
Value Area High (VAH) and Value Area Low (VAL):
These are the upper and lower boundaries of the Value Area, respectively. Prices at these levels often act as strong resistance (VAH) or support (VAL), guiding traders on potential trade entries or exits.
Point of Control (POC):
The POC is the price at which the market spent the most time trading or had the highest volume during the session. The market frequently returns to this price level, making it critical for analysis.
Understanding these concepts allows traders to recognize market conditions clearly and identify strong price levels for potential trades.
How Does a Market Profile Chart Actually Look?
Unlike candlestick charts, Market Profile charts visually organize price levels vertically. At each price, letters or blocks indicate periods of trading activity. The more letters or blocks at a certain price, the longer the market stayed or traded at that level, highlighting its importance.
For example, a simple Market Profile shape might resemble a bell curve, indicating that most trading activity was concentrated around a central price (POC). A “thin” area with fewer blocks means the market quickly rejected those price levels, showing less acceptance.
By examining these charts, traders quickly identify price levels of high acceptance (value areas) and low acceptance (rejected prices).
Practical Trading Strategies with Market Profile
Lets consider some practical ways to use Market Profile effectively:
Trading in a Balanced Market (D-shaped Profile)
When Market Profile forms a symmetrical “D-shape,” this indicates a balanced market. Neither buyers nor sellers dominate, so price moves within a well-defined range.
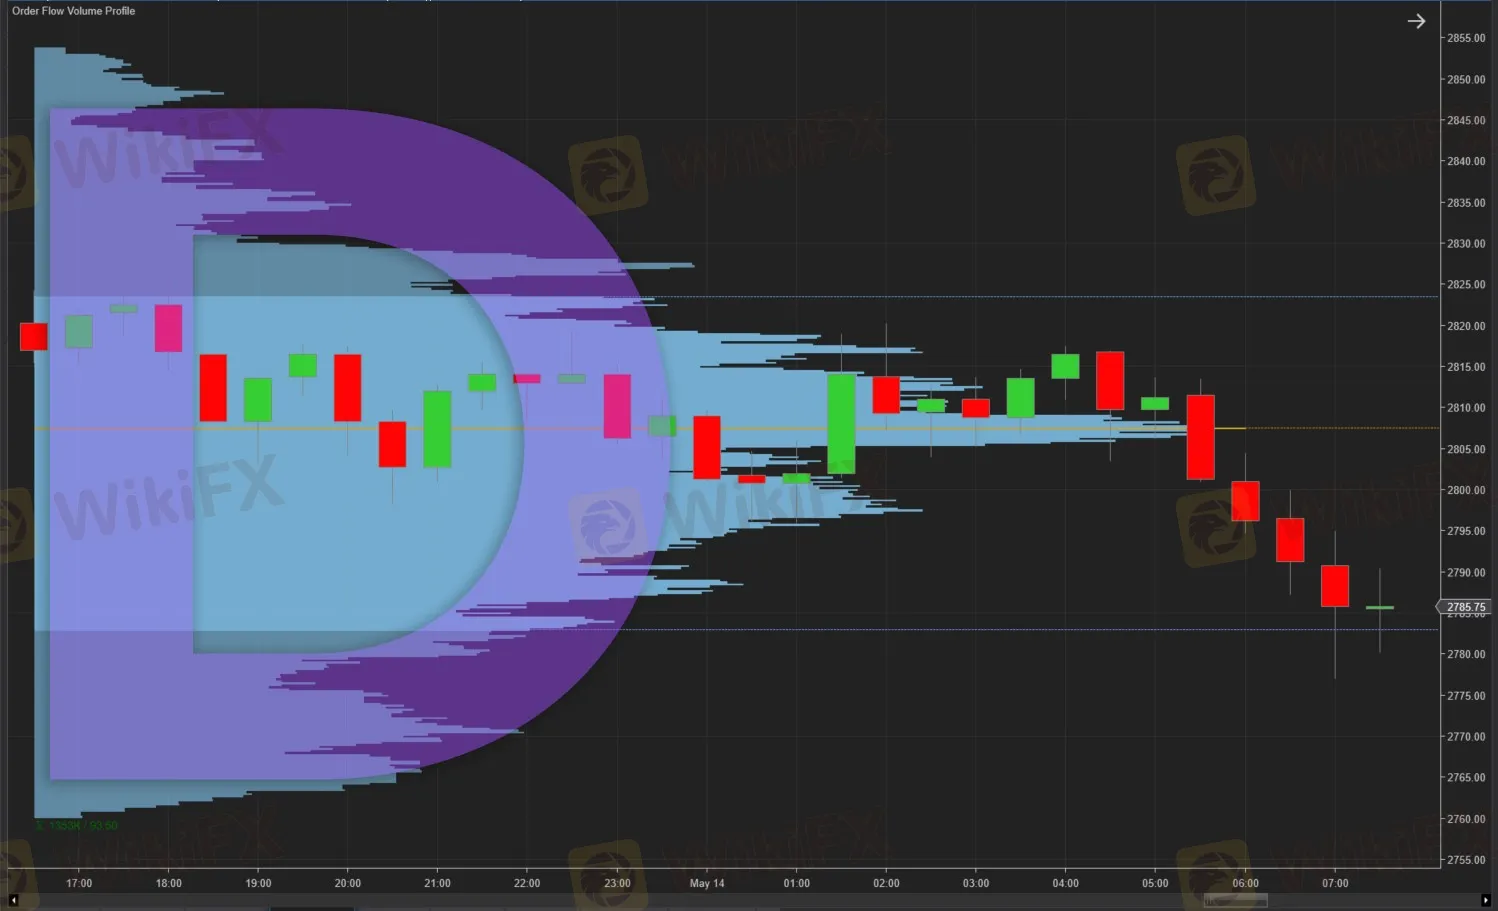
Traders typically approach such conditions by selling near the Value Area High and buying near the Value Area Low. Because the market sees these extremes as unfair prices, it naturally tends to revert toward the Point of Control.
Trading Trending Conditions (P-shaped and b-shaped Profiles)
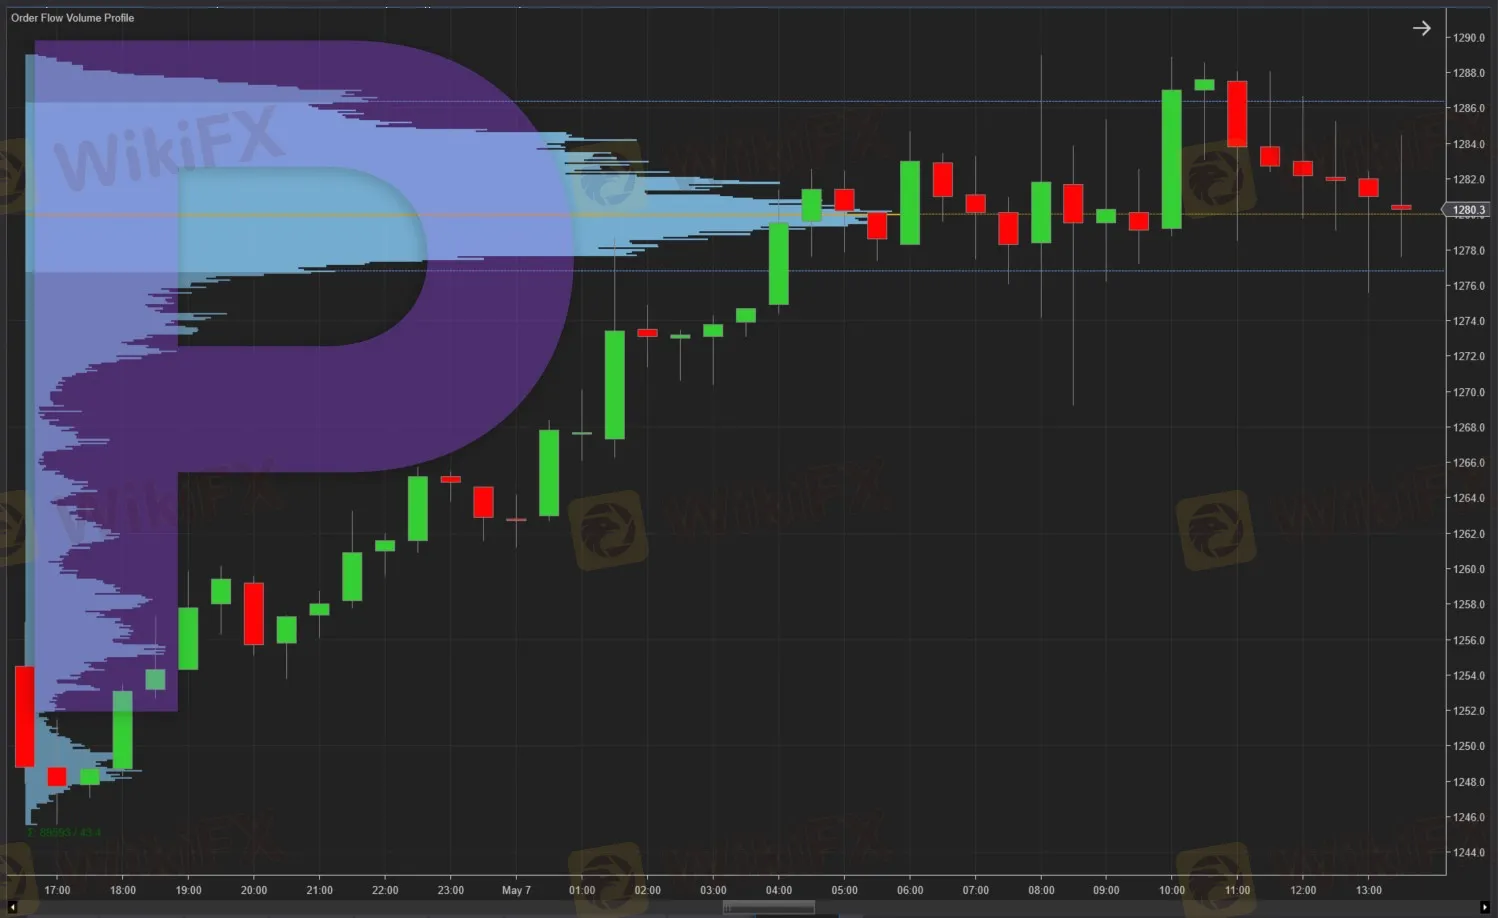
When you see a “P-shaped” profile, the market spent a short time at lower prices but stabilized at higher levels, indicating bullish strength. Traders usually look for opportunities to buy on small pullbacks toward the upper Value Area.
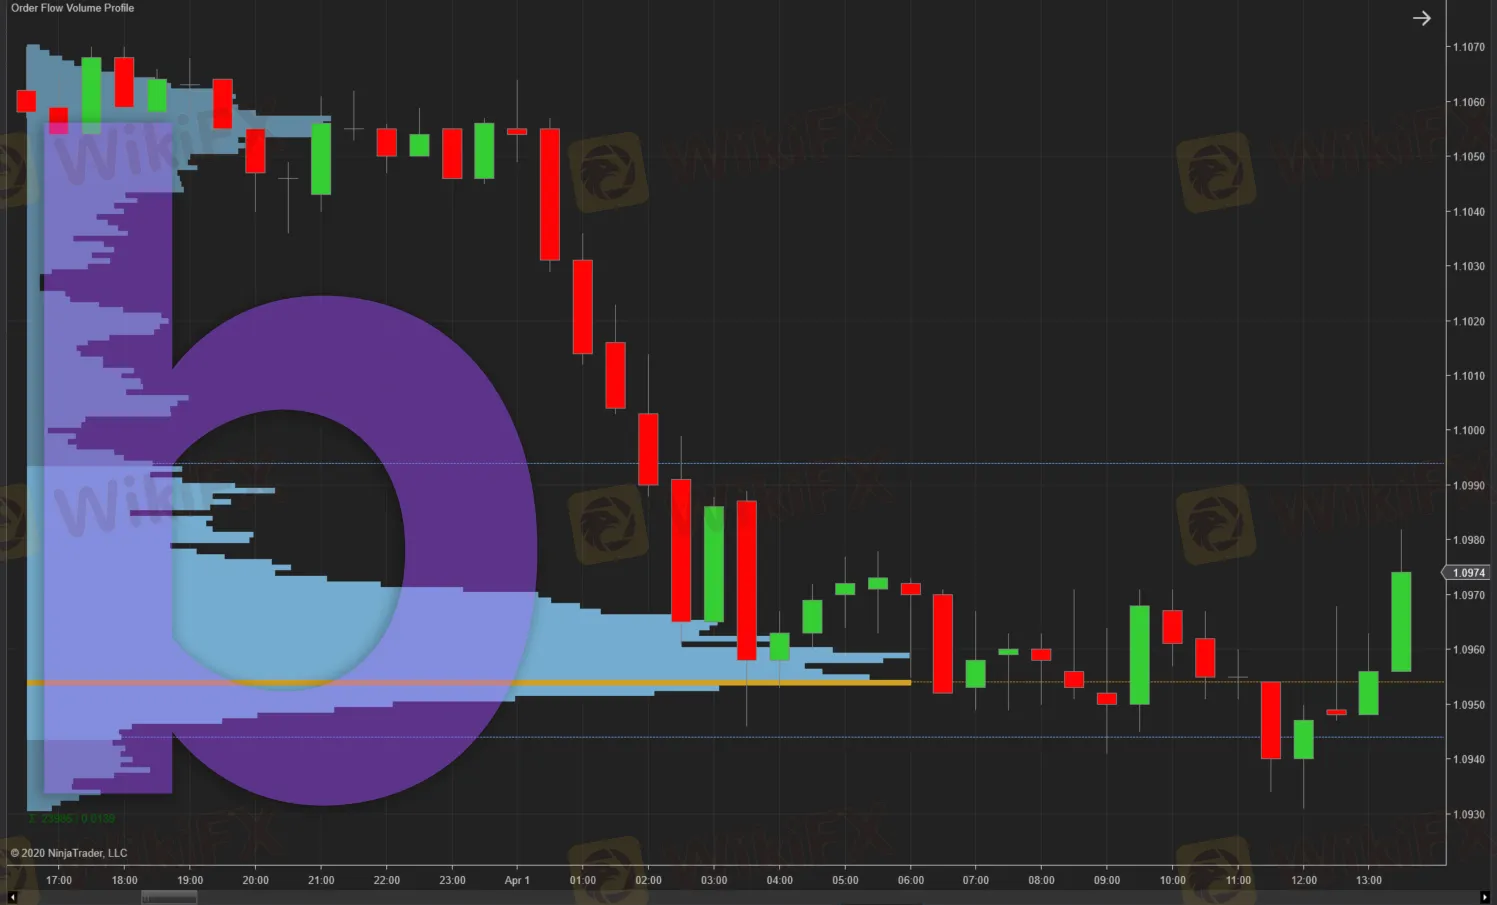
Conversely, a “b-shaped” profile reflects a bearish market, where prices stabilize after sharp declines. In this case, traders might seek short opportunities near the upper boundary of the value area during temporary rebounds.
Trading Double Distribution Days (B-shaped Profile)
On some trading days, the Market Profile might show two distinct areas of significant trading activity separated by a region of low trading volume. Traders call this a “double distribution day.”
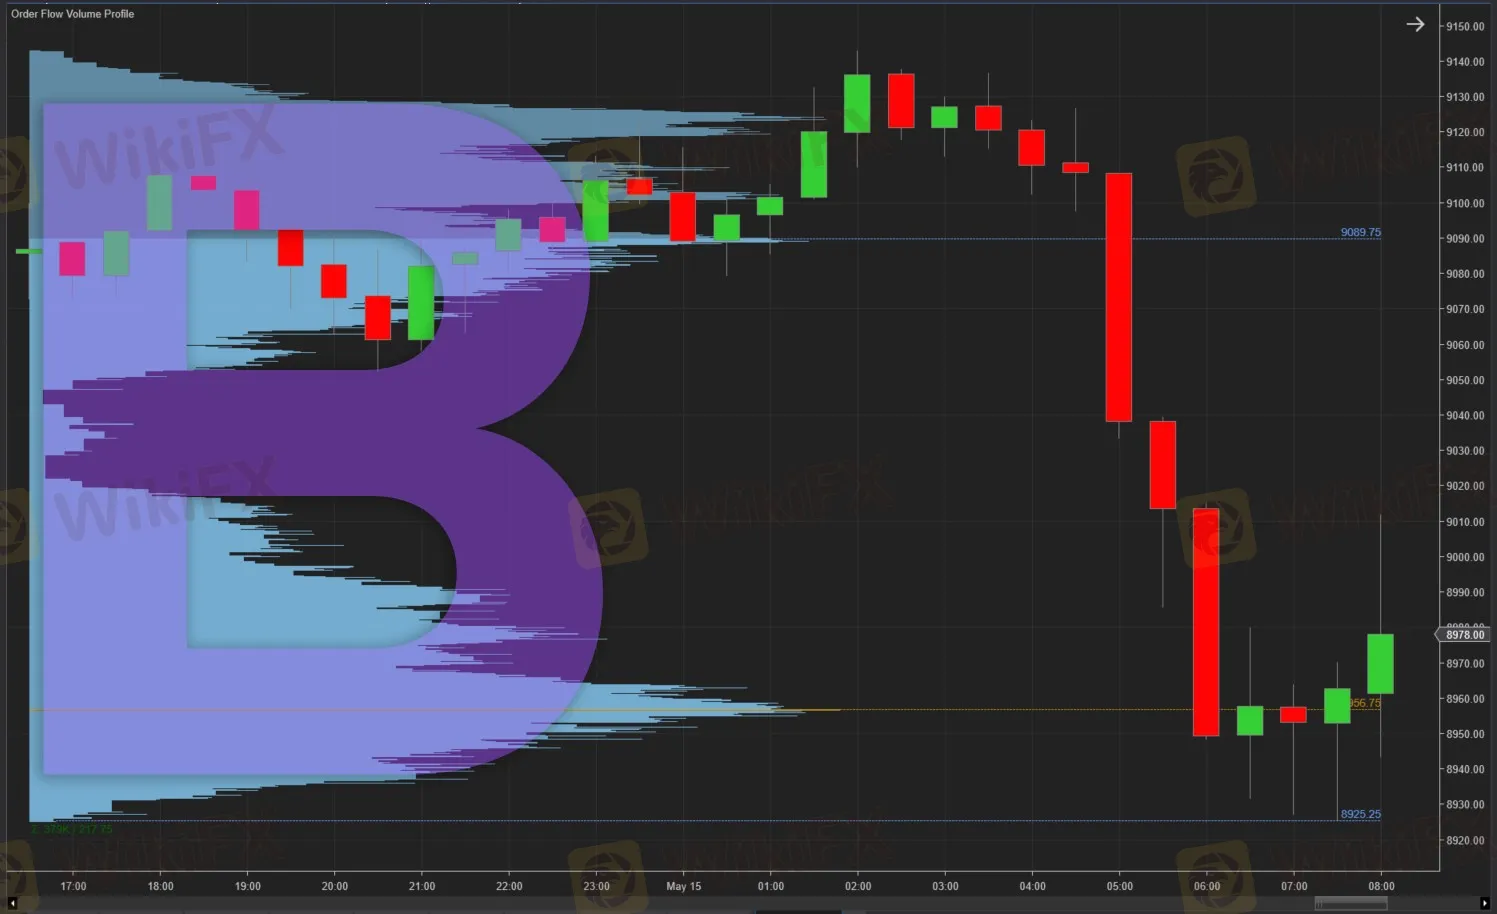
The area of low trading activity acts like a barrier. If price moves into this low-volume area again, traders expect a swift price move to the next area of high volume. These scenarios often provide clear breakout trading opportunities.
Using Market Profile in Actual Trading
Heres a realistic scenario to illustrate practical use:
Suppose yesterdays Market Profile shows a clear value area between 1.1050 (VAL) and 1.1100 (VAH), with the Point of Control at 1.1075.
If today‘s price moves above yesterday’s VAH (1.1100), observe carefully:
- A clear break above 1.1100, supported by volume, indicates market acceptance at higher prices, signaling a possible bullish continuation.
- A rejection (price returns below 1.1100 quickly) indicates that the market considers this level overvalued, suggesting a short opportunity targeting the POC at 1.1075 or lower.
By tracking these levels, traders can better anticipate market behavior and manage their positions effectively.
Common Questions Traders Ask about Market Profile
Is Market Profile suitable only for day traders?
No. Although day traders widely use it, Market Profile is equally beneficial for swing traders and long-term investors to identify key price zones and market sentiment over larger timeframes.
Which markets can I apply Market Profile to?
Market Profile can be applied to nearly any liquid market: stocks, futures, forex, commodities, and even cryptocurrencies. The key requirement is sufficient trading activity to generate meaningful profiles.
How do I get started with Market Profile?
Many popular trading platforms, such as TradingView, NinjaTrader, and Sierra Chart, provide Market Profile indicators. Traders can start by using demo accounts to familiarize themselves with reading and interpreting these charts before committing real capital.
Does Market Profile predict future market movements?
Market Profile does not directly predict future prices. Instead, it provides a clear visualization of current market sentiment and price acceptance levels. This insight helps traders understand likely future behaviors based on past and current trading patterns.
Final Thoughts: Why Market Profile Matters to Traders
In summary, Market Profile is a powerful analytical tool that clearly shows where the market sees fair value and where it doesnt. It helps traders identify key price levels, improving their timing for trade entries and exits and enhancing overall risk management.
While Market Profile does not replace traditional technical analysis methods, it complements them by offering a deeper, clearer view of market behavior. With practice, any trader—novice or experienced—can integrate Market Profile into their trading strategy to make more informed, confident decisions.
Disclaimer:
The views in this article only represent the author's personal views, and do not constitute investment advice on this platform. This platform does not guarantee the accuracy, completeness and timeliness of the information in the article, and will not be liable for any loss caused by the use of or reliance on the information in the article.
Read more
5 Cons of DB Investing Broker You Must Know
It's always advisable to read online review articles about forex brokers you are thinking to Invest your money with. The forex market has become increasingly unsafe due to the rise of fraudulent brokers. Review articles help you spot scam brokers and protect your money. Read this important article about DB Investing to stay fraud alert.
iForex - Where Withdrawal Denials, High Spread & Scams Spoil Your Forex Trading Mood
Are high spreads charged by iForex disallowing you to make profits? Do you feel that you will never be able to withdraw from iForex? It's nothing new! Read this exposure story where we have highlighted complaints from several investors.
Forex Hedging Strategies - Calming You Amid Market Chaos
Finding it hard to deal with the forex market volatility? Do those ups and downs in currency pair prices make you more nervous or worried? You need the right forex hedging strategies. As a concept, forex hedging is about strategically opening additional positions to stay immune against adverse forex price movements. It’s about offsetting or balancing your current positions by buying or selling financial instruments. As a trader, your risk exposure is reduced, hence limiting your potential losses.

Scam Alert: Cloned Broker Scams on the Rise
Reputed authorities like the FCA have issued warnings against brokers who act genuine but are actually fake brokers. They copy details such as logos, names, branding, and sometimes even employee appearances to trick investors and steal money from them.
WikiFX Broker
Latest News
Forex Hedging Strategies - Calming You Amid Market Chaos
 WikiFX
Key Events This Week: ISM, Trade Balance And More Earnings
WikiFXWhat Is Forex Currency Trading? Explained Simply
WikiFXASIC Regulated Forex Brokers: Why Licensing Still Matters in 2025
WikiFXA Beginner’s Guide to Trading Forex During News Releases
WikiFXUltima Markets enters the UK and gains the FCA license
WikiFXLSEG Announces £1 Billion Share Buyback Program
WikiFXSEC Lawsuit Targets Real Estate Fraud Scheme by Joseph Nantomah
WikiFXThink Uncle Sam Owes $37 Trillion? It's Far Worse Than That
WikiFXSkyLine Judge Community: Appreciation Dinner Successfully Held in Malaysia
WikiFXCurrency Calculator

